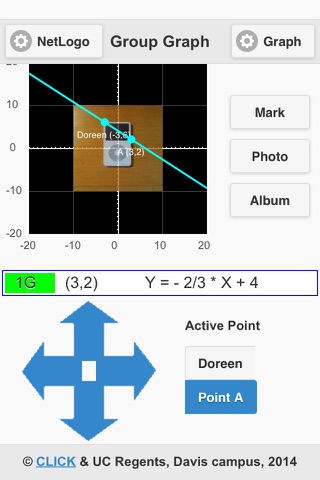
In Graphing in Groups, students work alone or in pairs to construct graphs of linear functions by using their respective iOS devices to move points in a shared Cartesian window. The Graphing in Groups NetLogo Hubnet model allows a teacher to view and display the graphing windows for all student pairs. Two pairs, one yellow and one green, can form lines in each graphing window. As students move their points in their respective graphing windows, they can mark select locations to form lines, the y=mx+b equation for which is displayed above or below the graph. This configuration allows students to participate in a variety of structured or open-ended collaborative mathematics tasks involving generating lines with particular properties—a specific slope or intercept, a parallel or perpendicular relationship to another group’s line, passage through a select point, and so on.
With the Graphing in Groups application students can
- give their point a custom name
- use arrow keys to move their point on a Cartesian graph
- draw lines between their point and a second point
- learn about y=mx+b, by observing the effect of point movement on the equation
- use the built-in camera or photo library to generate graphing background images
- change the scale of their graphs
- work individually, using a second point to construct their own lines
- work collaboratively, seeing their partners point, creating lines together
- send photos and graphing commands to the teachers computer, for the whole class to see
Detailed instructions for using Graphing In Groups can be found on the website.


